Case Page PEOPLE ANALYTICS
This dashboard case shows how compensation discussions become faster when managers and HRBP share one visual source of truth.
2025-2026 | Tableau | Compensation Operations
People Analytics Dashboard
This case explores how a compensation dashboard can move teams from manual spreadsheet checking to a clearer, shared decision view during annual salary and bonus cycles.

Background
The project started from a practical problem: compensation review was taking too long because inputs were spread across multiple files and regional cuts.
Managers had data, but not a single view that was easy to interpret in calibration discussions.
The Question
How can compensation data be structured so HRBP and managers can quickly understand pay positioning, progression, and potential fairness risks before decisions are finalized?
Method
Dashboard View
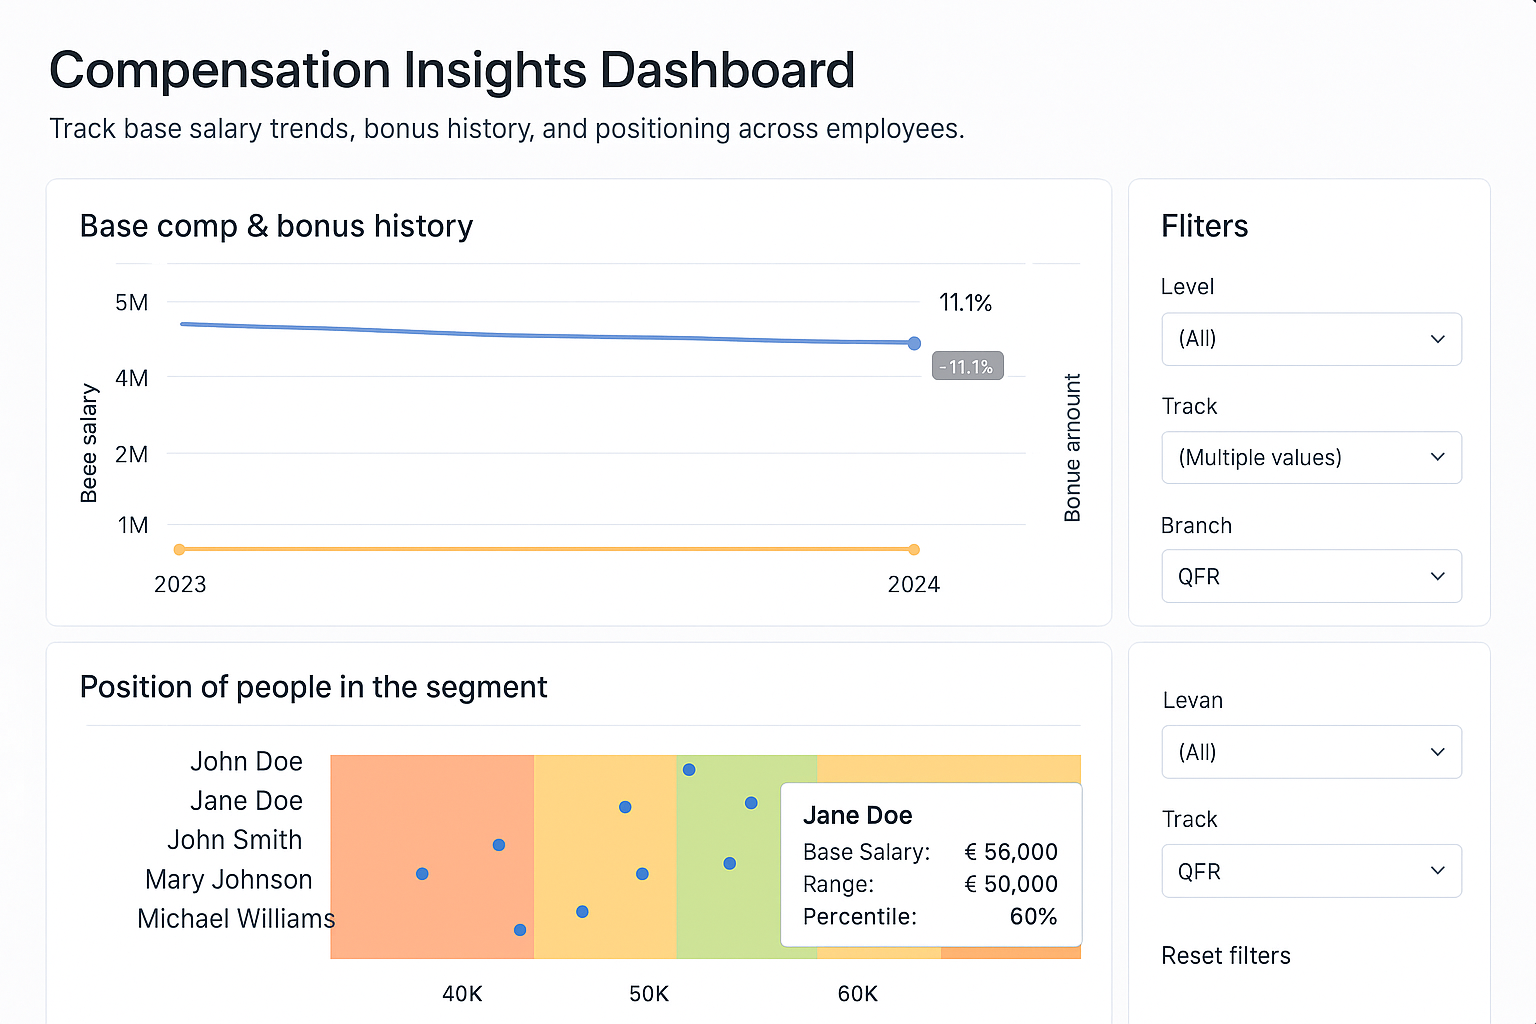
Dashboard screenshot uses edited/generated values for confidentiality while keeping analysis structure intact.
What The Dashboard Enables
Key Insights
- Visualization reduced dependency on spreadsheet stitching during cycle prep.
- One shared view improved consistency in manager-facing compensation narratives.
- Outliers became easier to isolate and discuss with evidence, not assumptions.
Practical Next Steps
In a production C&B setup, the next iteration would focus on governance and repeatability.
- Standardize refresh process and ownership by cycle phase.
- Add stronger exception logging and approval traceability.
- Expand dashboard views for additional job families.
Tableau Compensation Analytics Calibration Support HRBP Decision Tooling